...using pyqtgraph.
Why?
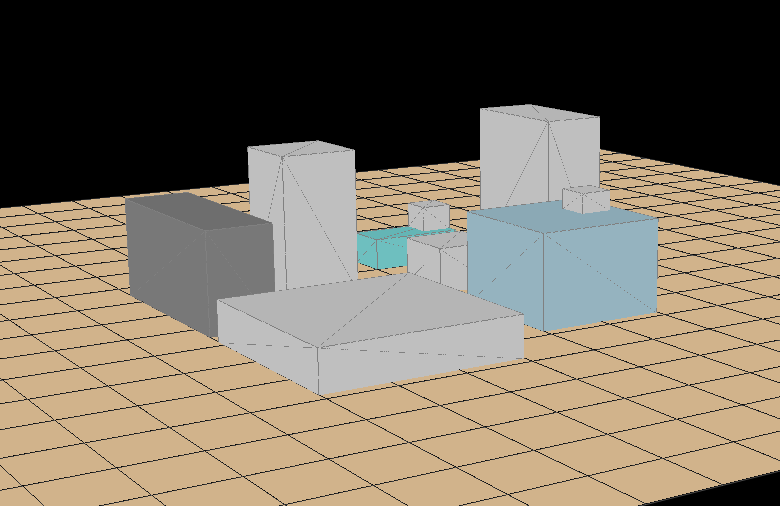
Because of a project involving solar-thermal panels, at the beginning of this year, I realized that the way of obtaining how much shadow-per-year-percentage an object projects over another object was very inaccurate. So I attempted to create a sun-simulator, where you place the objects that are near to the place you want to study and then, run a script that draws shadows (with their grey color as a function of the % of shadow) over the place. That way, you can smartly place your solar collector.
I've not gone that further, I left the (short) development once I knew that something ~ similar existed for free. Don't reinvent the wheel.
But I want to show this, because maybe it helps you to go a step forward with your own project.
The code is posted here (there are comments explaining how to create "buildings" and "panels")
If you have pyqtgraph in your system, copy and paste the code in a python terminal and you should see something.
I've been playing today with the camera positions, with the remote idea of a video-game in mind.
Camera command (I haven't found this at pyqtgraph docs, but here) example:
WINDOWOBJECT.setCameraPosition(distance=100,elevation=10,azimuth=30)
Greetings, Javier
add one more line at the end
ReplyDelete>app.exec_()
in order to run it as a standalone program
Hi Javier, what do you have in mind when you say "something ~ similar existed for free"?
ReplyDeleteUnknown: Back then I found some free software from the spanish goverment that could do something very similar. Unfortunetly, I could not found it in a quick search, but found a lot of similar tools. With the "~" i want to say that it was free of charge, but not sure about open source.
ReplyDelete